
It’s just common sense. The faster you go, the longer it takes you to stop.
BUT, how much longer? This week, we’re going to look at the relationship between stopping distance and speed, and then throw in the human factor.
I’ve investigated hundreds of collisions that occurred only because the driver was simply going too fast. They didn’t understand the relationship between speed and how long it takes to stop. Then, for those of us that tow an RV or drive a heavy class A or C, you have to throw in the added kinetic energy that those vehicle/RV combinations have.
WARNING: CRASH GEEK CONTENT BELOW!
I’ll confess that I’m a metrican, so the following calculations will be in metric.
Some laboratory type examples:
- Car traveling 50Km/h (~31mph) will take about 14.6m to stop in dry pavement. This assumes all brakes are working.
- Same car traveling 70Km/h (~43mph) will take 27.5m to stop (almost exactly double!)
Who would have thought that an increase of 20Km/h (12mph) would have doubled the stopping distance? For those that want to know, the formula is:
d = s²/254µ
where:
d = distance in meters
s = speed in Km/h
µ = coefficent of friction of roadway
Now, the human factor. Based on research done by a guy named Paul Olson, the 85th percentile (85/100 people) perception/reaction (P/R) time for a driver that is faced with an unexpected roadway hazard is 1.5 seconds. Interestingly the 95th percentile number is a longer 1.6 seconds.
“Now, HOLD ON A MINUTE! You’re trying to tell us that it takes a second a half for a driver to react to a hazard? I can do it faster than that!”
A little further explanation may be necessary here. Say I told you that I was conducting an experiment to measure your reaction time. I’ll set up a light bulb and a device like a “Jeopardy buzzer”. When the light comes on, hit the button, and I’ll measure your reaction time. Think you could do it faster than a second and a half? Of course you could; and here’s why:
- I told you I was running an experiment to check reaction time — you’re ready
- I told you what the stimulus was going to be (the light-bulb coming on)
- I dictated your response (hit the button)
All of those things will serve to reduce the amount of time it takes you to react. Driving isn’t like that. There is a myriad of possible responses to a roadway hazard. You can brake, steer, honk the horn, flash you lights, something else, or a combination of those possibilities. Then, once you decide what to do, you have to execute that decision — and this all happens unexpectedly.
During the P/R phase of a pre-collision event, the vehicle is usually traveling at what is assumed to be a constant speed. Now you take that 1.5 seconds, and convert that 50Km/h speed into meters/second (50Km/h = 13.88m/s or around 45 feet/sec), and you see that while the driver is deciding what to do and doing it, the vehicle will travel (13.88 x 1.5 = 20.8m). Then add the 14.6m it takes to stop from that speed, and you see that the total stopping distance is 14.6 + 20.8 = 35.4m, or over a hundred feet. This is why, especially in urban areas, drivers need to pay attention to their driving and obey speed limits. Distances to crosswalks from their “crosswalk ahead” signs, proximity of crosswalks to curves, radius of roadway curves to be negotiated in all kinds of weather, and speed limits are all factored using this type of logic by the roadway engineers.

Where I live, the speed limits in School Zones is 40Km/h (25mph) instead of the usual 50km/h (31mph). Is that 10Km/h (6 mph) really going to make that much difference if the worst happens and a child is struck? The answer is YES. Research says that if a pedestrian is struck at 60Km/h (35mph), there is roughly a 85% mortality rate. Decrease that speed to 40Km/h (25mph), and the mortality rate drops to about 15%. I won’t go into anatomy and why this is so, but I’ll simply say that it based on the ability of the body to protect itself from injury. The higher speeds create forces of injury the body simply cannot survive. Aortas tear, and brain injury is common.
Speed limits are in place for a reason, and it’s best to abide by them. Speed isn’t the most common cause of crashes, inattention is — at least based on my experience. But, if you are unfortunate enough to be in a collision, the faster you are going, the more severe the impact is going to be – for you and the other person. Slow down, pay attention, and enjoy the ride.
Next week, I’ll be talking about safety innovations is vehicles. Which ones should you spend your money on, and which may not be the best “bang for the buck”. See you then!
Feel free to leave a comment below, or post in the forum thread:
http://www.rv.net/forum/index.cfm/fuseaction/thread/tid/20876104/p/1.cfm
Pingback: dont approve me
Penelopa
This is awesome !!! Good work
ib516
Great questions Jim.
First of all, we have percentages of braking available for when we are dealing with air or electric actualted brakes vs regular hydraulically operated brakes (juice brakes). We just adjust the coefficient of friction accordingly, and each axle can be calculated for independently, then the results are combined together to get a final result.
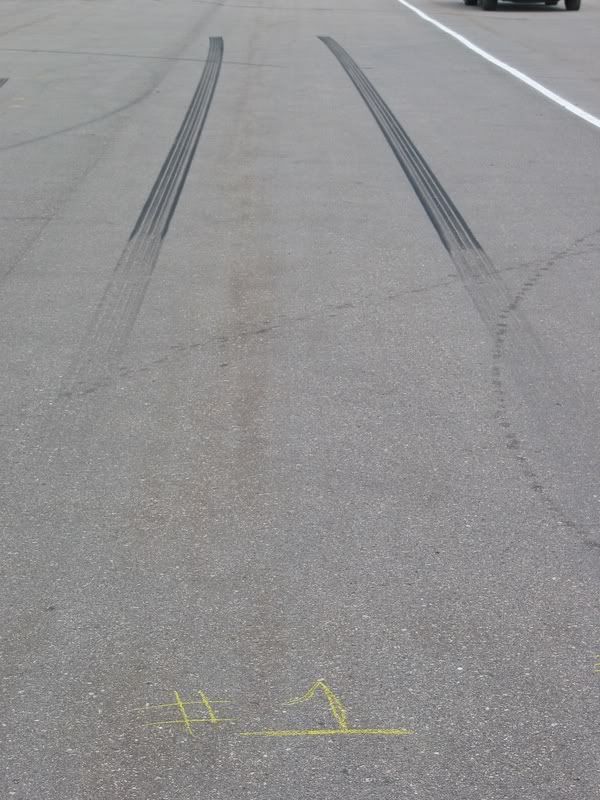
On the subject of ABS brakes leaving marks, they do in fact leave marks that a trained eye can pick up on. Then they are measured accordingly. They are lighter and harder to see, but they are there, and calculations can be done from them.
I just spent a week training some new officers on collision investigation, and we made ABDS marks and regular skid marks during training. Today at the test track, we even made and identified ABS braking marks on a snowy surface. The trainees had to identify, mark, measure, and do calculations from the ABS marks that I made with our 2005 Ford Expedition. I was going 43Km/h when I began braking, the 2 groups of trainees came up with 40Km/h and 41Km/h for my speed based on their measurements of my tire marks. The way it works, the speed the investigator comes up with will be slightly under the actual speed due to a number of factors, but they will be very close to actual if it is all done as it should be.
jimnlin
great subject.
I have towed “legally” commercial/DOT/CDL/proper paper/etc for about eight years (some years back) with 3500 DRW trucks and GN flatdeck trailers from 18′ to 38′ tandam dually axles. Some of those trailers had electric brakes like our RVs which are minimal. Some of the better longer commercial flatdecks have very large hydraulic, disc or drum, brakes. I usually ran 28000 lb combined plates for my bigger trailers. When I say legally that means the truck is within all manufactors axle/tire capacities (door tag). I ‘ve always wondered if investigators take in consideration those very large hydraulic brakes on the more expensive trailers vs just the minimal electric brakes on the lower price trailers. I know from a operators standpoint those big brakes on my 36″ flatdeck and my 3500 DRW loaded combined 25000-28000 lbs would stop a load much quicker than one of my smaller trailers with electric brakes and only 14000-15000 lb loads.
Another question regards skid marks. Our older vehicles would leave skid marks for LEO to measure. With anti skid how do you guys figure/measure without those skid marks. Thanks ……….JIM
Steve Bodiford
This is a very interesting Blog, Im glad you are taking the time to do it. Thanks.
Pingback: Driving in Poor Weather
wsb711
1 meter = 3.280 839 895 013 feet
Al
Outstanding Article!
Definitely puts speed and distance to the vehicle in front of me in perspective.
Some hints on how to defend myself from the tailgaters at 3 meters behind my rear bumper would be helpful.
ib516
For the conversion, a meter (m) is about 3.3 feet. That should help out you non-metricans 🙂
Mac McClellan
Very good information! I like the way you give us the basics, then the advanced info, so if someone wants the details they can dig into it.
Real expert information is great instead of what somebody’s cousin/friend/brother who works at a service station/u-haul/lexus dealer says (or similar situation).
Mike Steffen
Good article !! I just got back from a single car roll-over this morning and as is normal in these cases it was too much speed. The driver had come from Houston to my neck of the brush in far west Texas, about a 14 – 16 hour drive so he was tired and in a hurry to make it into El Paso. I service abut 3 or more of these a week and in all most all cases it’s from driving beyond the drivers skill and/or the road conditions. Good work again !!
Mike (The Old Ranger)
bob lilienthal
So, who is going to translate all this fine work from meters to feet (or yards) for those of us who don’t understand what he’s talking about.
Lug_Nut
Great write-up. I guess you could even add in more delay for diesel pushers given the reaction of air brakes.
Peter